FNA Process: Working with Pivot Tables
Why Use Pivot Tables?
When you combine rasters, the resulting table contains one row per unique combination of values from both rasters. This means that, in this example, the same EVT can be split into multiple rows, each associated with different BPS values. Consequently, you can’t simply sum the EVT acres directly from the table because the EVT acres are distributed across multiple rows.
Pivot tables allow us to summarize and aggregate data effectively. Here’s why we need to use pivot tables in this context:
Summarizing EVT Acres
- Since EVT acres are split across multiple rows, we need to use a pivot table to aggregate the total acres for each EVT. This ensures we get an accurate representation of the total area covered by each vegetation type.
Calculating Average Fire Return Interval (FRI)
- The FRI values are tied to the underlying BpS pixels, meaning different pixels of the same EVT might have different FRI values. Using a pivot table allows us to calculate the average FRI for each EVT by summarizing the FRI values across all relevant rows.
Summarizing FRI Acres
- To understand the total number of acres that should burn annually based on historical fire return intervals, we need to summarize the FRI acres. Pivot tables help us aggregate these values to get a comprehensive view of fire needs for each EVT.
Step-by-step process
Screenshots of the process are included below the written instructions for those who find them useful.
Insert the pivot table
Select the range of cells that contains your data. Make sure to include the column headers.
Go to the Insert tab on the Excel ribbon.
Click on PivotTable in the Tables group.
In the Create PivotTable dialog box, ensure the selected range is correct.
Choose to place the pivot table in a new worksheet or an existing worksheet. For this tutorial, select “New Worksheet” and click OK.
Set Up Your Pivot Table to summarize EVT data
A new worksheet will open with a blank pivot table and the PivotTable Fields pane on the right.
Drag and drop fields into the appropriate areas:
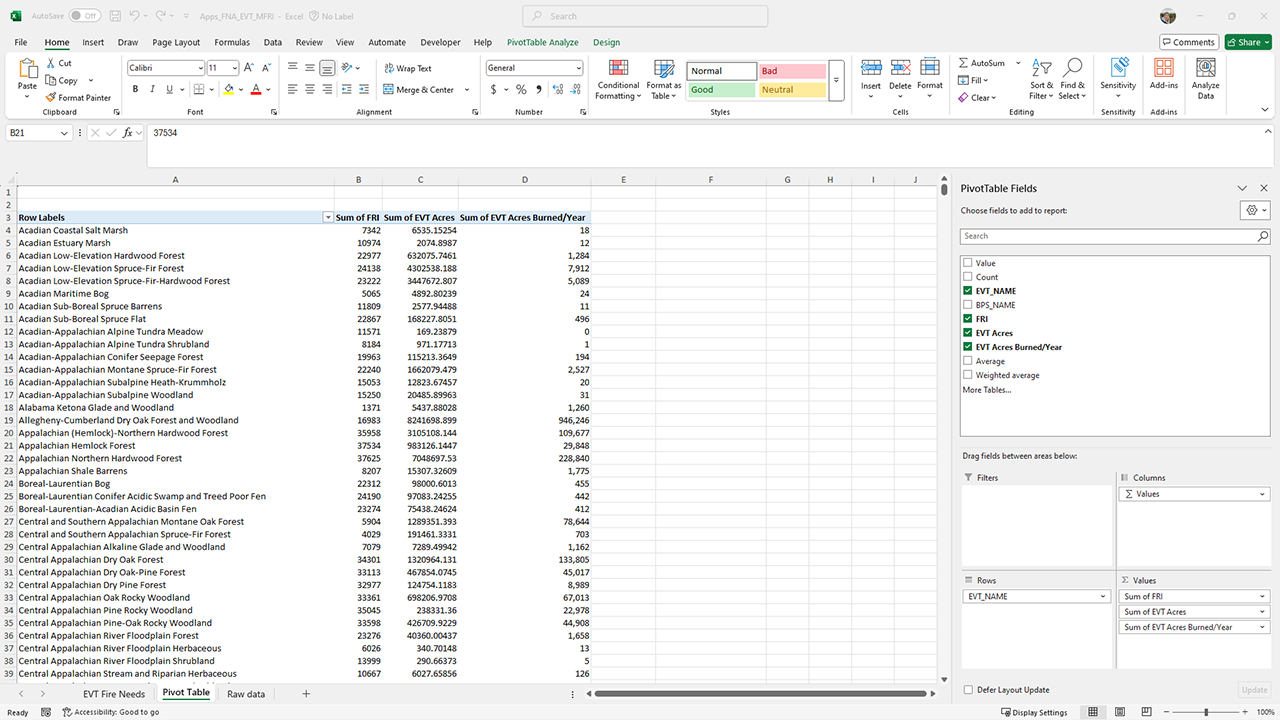
Rows: Drag the field you want to categorize your data by. In our case, we want to look at the EVT_NAME field.
Columns: Drag the field you want to compare across categories. In our case, we want to look at the value fields we just set, which the pivot table will choose automatically.
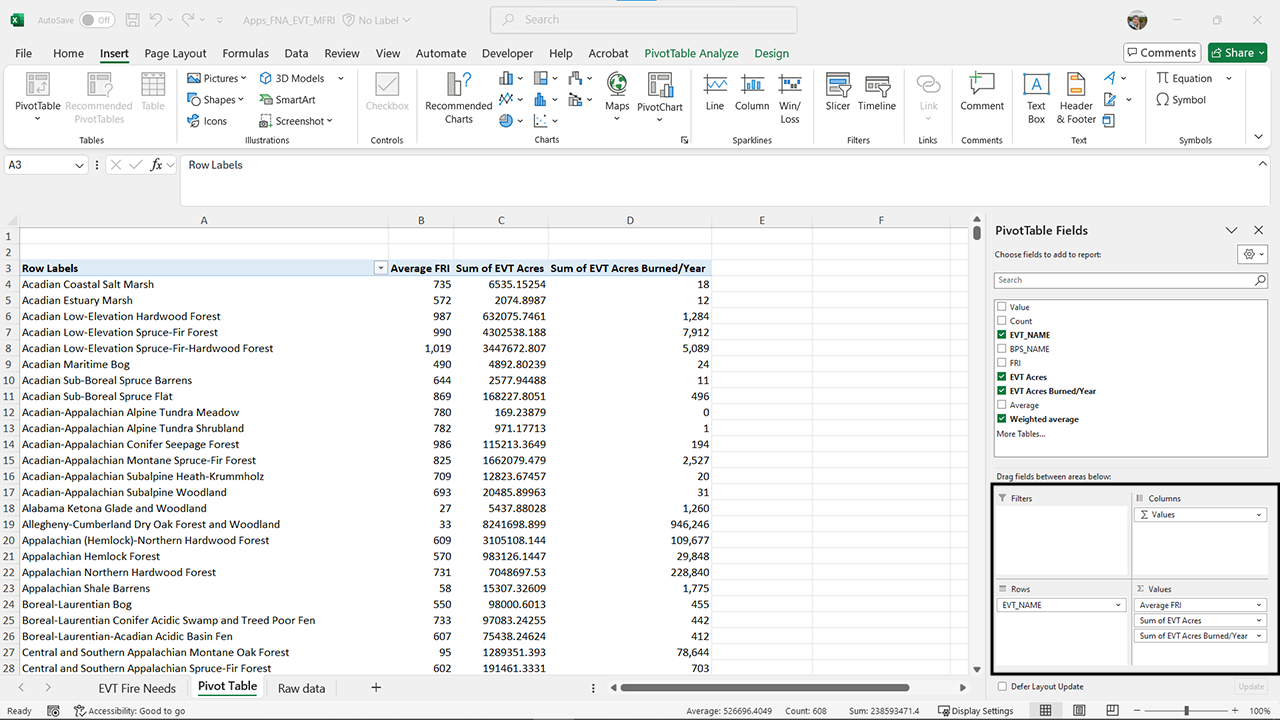
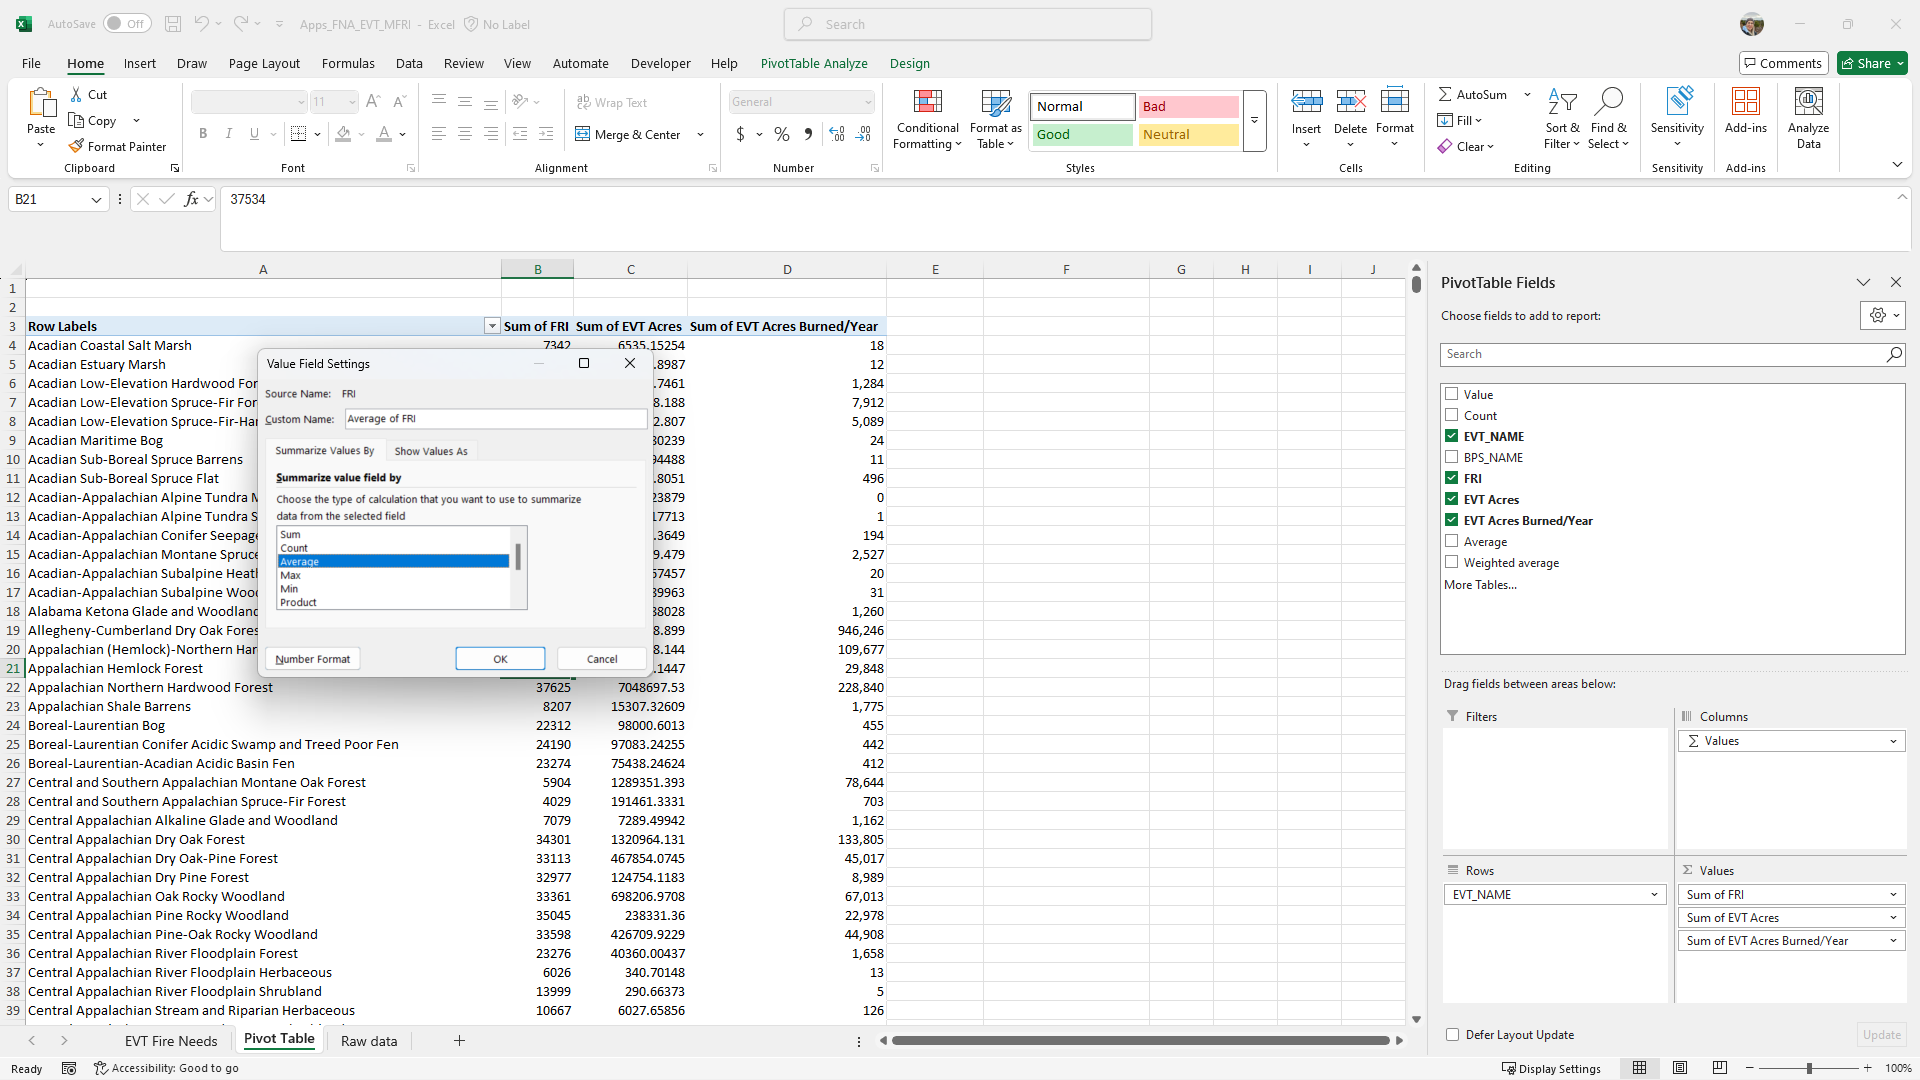
Values: Drag the fields you want to summarize. In our case, we want to look at FRI_ALLFIR, EVT Acres, and EVT Acres burned per year. By default, Excel will sum these values, but you can change the summary function by clicking on the field in the Values area and selecting “Value Field Settings”.
- You will want to change the value fields for the FRI_ALLFIR field, as we want to look at the average FRI, not the summed FRI. To do this, click the drop-down arrow next to the field name, then choose Average from the Summarize value fields by options box.
This is not a weighted average of the FRI, just a straight average. While this number will give you a good starting place, it’s best practice to use a weighted average – taking into account how many acres of a given BPS were in the underlying EVT area – to get a more representative fire return interval for the landscape. The process for creating the weighted average FRI using the pivot table is in the following section.
Screenshots for creating the pivot table
This process will help you summarize your data, making it easier to understand and present your fire needs assessment results.
Still have questions? LANDFIRE is here to help.
Ask the LANDFIRE Helpdesk (email link).
Search and subscribe to the LANDFIRE YouTube Channel (see tutorials, Office Hours, quick demonstrations).
Join an Office Hour (monthly meeting with open format Q & A with LANDFIRE experts).
Schedule a meeting (email link) with TNC’s LANDFIRE Team.